What's Happening Events
Mar 2025
(Wed)
How can we do Seasonal Price Analysis on the Stocks in a Sector? (19 Mar 2025)
- Subject
- FinTech and Financial Analytics
Thanks for your participation!
The above event has been completed successfully. Please look forward to the upcoming events.
Want to read more about the event recap?
- Date & time
- 19Mar 2025 (Wed)13:00 - 13:45
- Fee
- Free
Mr Danny W. C. Chan
Mr. Chan, FRM, has possessed rich experience in financial risk management, information technology and data science and worked as IT Manager over a decade. Being a practitioner in information technology, he is currently a consultant and trainer at Big Data Consultancy Services Company. Also, he is strong in Cloud-based solutions, Big Data Technology, Data Mining and Machine Learning. Moreover, Mr. Chan has obtained a Bachelor Degree in Mathematics from The Chinese University of Hong Kong as well as three Master Degrees in Risk Management Science from The Chinese University of Hong Kong, Quantitative Analysis for Business from City University of Hong Kong and Industrial Logistics Systems from The Hong Kong Polytechnic University.
- Enquiry
- 2867 8331 / 2867 8424 (finedec@hkuspace.hku.hk)
- Relevant Programmes
- moreRelevant Programmes

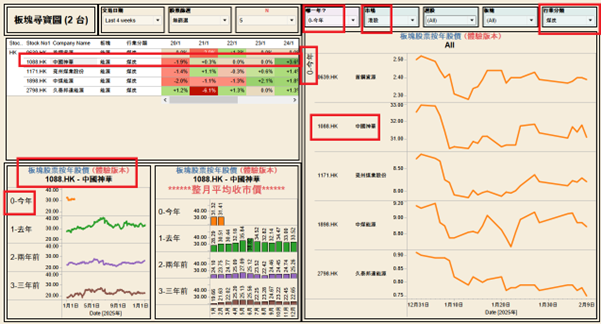
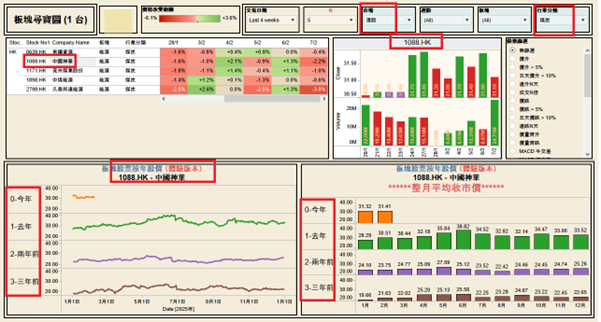
I have two questions for you:
1. How can we compare the stock price trends for a specific year of all the stocks in a specific sector?
2. How can we make the same comparison for a specific stock across different years in parallel?
The significance of the above graphic presentations is to identify any cyclical (i.e. yearly) pattern of stock price trend across certain dimensions.
This involves superb techniques of data visualization with Tableau. People may think that it is extremely hard skill to design such a stock price analytic dashboard but Mr. Chan, the speaker, would demonstrate his dashboard design during this talk.
If you are passionate about watching the demonstration to answer the above two questions, do not hesitate to register for this event that would inspire you to make data-driven decisions on sectoral stock price analytics.
Language: Cantonese (Supplemented with English)
Sample Screens: